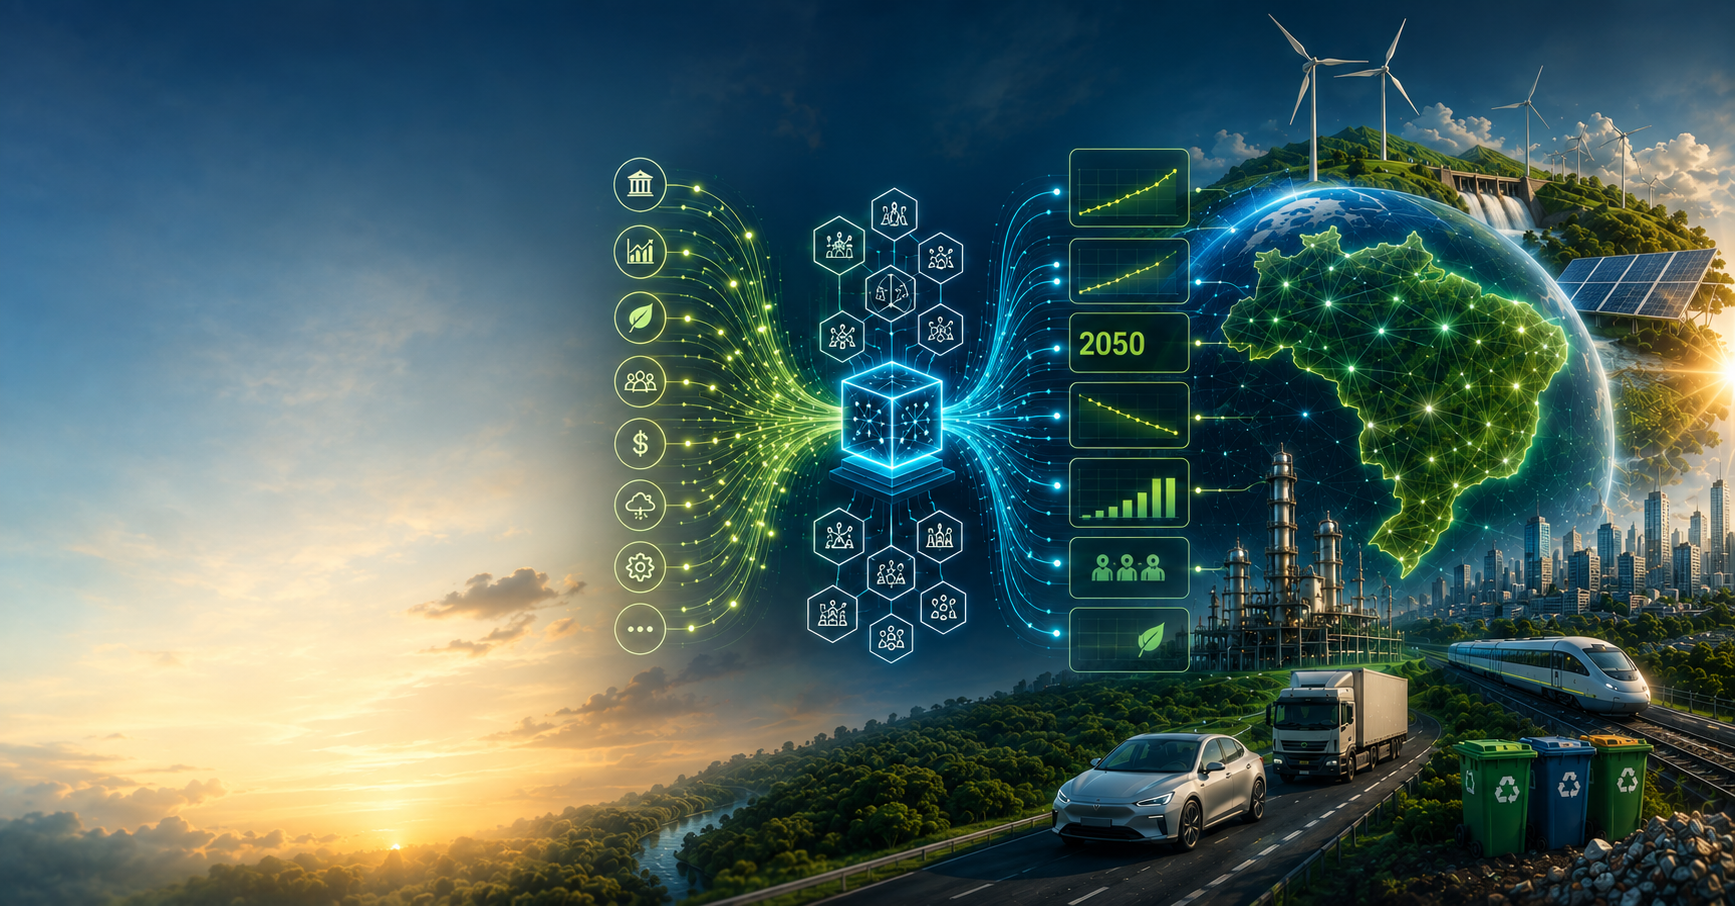
The question is no longer whether Brazil reaches net zero.
It's how.
NetZero Brazil (NZB) integrates eight scientific models into a single computational infrastructure to build, compare, and test the pathways that lead the country to climate neutrality between 2040 and 2050.
Climate data,
open and reliable.
Fifteen years of historical CO₂ emissions series, by sector and by state, on a single transparent and navigable platform.
A method tested globally, present in more than 5 countries. A challenge unique here.
Born in the US, applied in more than 5 countries
The NetZero approach was originally developed by Princeton University and today guides similar initiatives in India, China, Poland, Korea, Australia, and Brazil — always around the same question: which pathway leads to net zero at the lowest cost and greatest feasibility?
A unique emissions profile
Unlike most developed countries, in Brazil land use, deforestation, and agriculture account for a significant share of emissions — not just energy. NZB was created to model this specific challenge, engaging with initiatives such as the Climate Plan and the Climate Observatory.
How it works
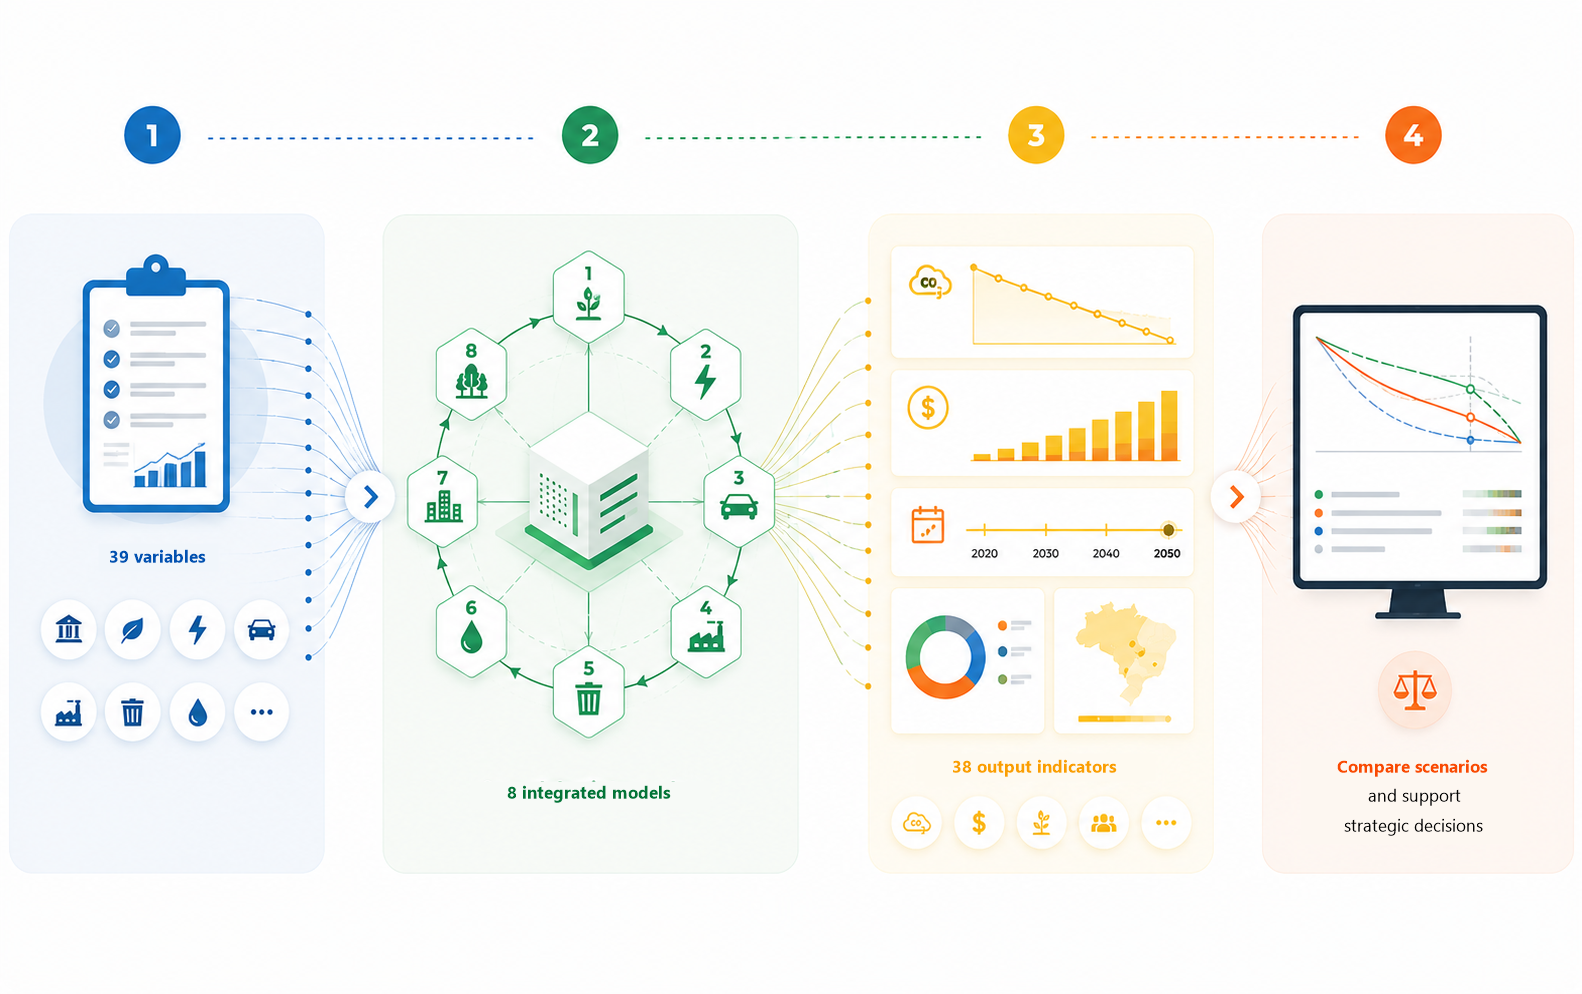
Build your own scenario by adjusting 39 parameters across 8 categories — from deforestation targets to energy mix — and see, within hours, the effects on emissions, GDP, jobs, investment, and land use through 2050. No sign-up, with open data and open code.
Who makes it and who supports it


An approach that already guides six countries
"Which pathways make it possible to reach net-zero emissions at the lowest cost and greatest feasibility?"
The NetZero approach was initially developed in the United States, in the Net-Zero America study by Princeton University, and is now applied in different countries — India, China, Poland, Korea, Australia and, now, Brazil.
To answer this question in each country, the method combines economic modeling, comparable scenarios, and cost analysis, always with full transparency in the data and code used. The result is not a single answer, but a set of possible pathways — each with implications for technology, investment, and public policy.
An emissions profile that demands its own method
Unlike most countries, where emissions are concentrated in the energy system, in Brazil land-use change, deforestation, agriculture, and methane account for a significant share of the national total.
A distinctive starting point
A predominantly renewable electricity grid, the largest tropical forest on the planet, potential for food, bioenergy, and advanced fuels, and abundant natural resources.
NZB engages, doesn't replace
The country has studies and commitments such as the Climate Plan, Brazil Net-Zero 2040, the Climate Observatory, MCTI's Mitigation scenarios, and research from CentroClima/COPPE-UFRJ. NZB expands and connects this ecosystem.
An initiative organized into four products
The NZB project is not just a single tool. It takes shape as four complementary products — each with a specific audience and purpose, from public access to scenarios to the complete technical documentation of the methodology.
NZB Platform
Free public platform for scenario analysis and creation — the entry point for any user to explore data, adjust parameters, and compare pathways.
NZB Machine
Internal processing platform that integrates the 8 scientific models, turning user-defined assumptions into sectoral and territorial results.
MASS Report
The project's methodological document — brings together methods, assumptions, scenarios, and sensitivities as a complete, ongoing technical reference.
Code repository
Public repository with the full source code of the models and the platform, ensuring auditability and letting anyone reproduce the results.
Six capabilities brought together in one infrastructure
NZB's biggest differentiator isn't in any single model — it's in bringing together, in one infrastructure, capabilities that were previously scattered across institutions and independent processes.
Sector integration
Full view of the interactions between sectors of the economy.
High spatial resolution
Results allocated across the territory, by state and municipality.
Flexibility for the user
Create, edit, and compare scenarios with freedom and autonomy.
Transparency and open science
Methodologies, data, and code open to everyone.
Scalability and modularity
An evolving platform that incorporates new models and data.
Network collaboration
Built by a wide network of institutions and experts.
Bidirectional scenario building
Instead of simply asking "what happens if we adopt a policy?", the NZB Machine checks whether a feasible solution exists within the user's constraints and searches for the lowest-cost combination to reach net zero — combining top-down logic (models) with bottom-up logic (user-defined priorities).
A single tool for every stakeholder group
The transition to a net-zero emissions economy involves decisions from different actors — each with distinct questions.
Evaluate public policies, investment priorities, and their economic and social impacts.
Analyze risks, opportunities, and technology pathways to guide long-term investments.
Understand how each scenario changes financing needs, climate risks, and new business opportunities.
Improve models and expand knowledge about the transformations of the Brazilian economy.
Access transparent information to take part in public debate on common technical ground.
Who makes NZB
A multidisciplinary team of researchers, data scientists, and climate specialists.
An initiative of universities, institutes, and civil society
The result of collaboration between Brazilian and international institutions that have produced knowledge on climate, energy, land use, and sustainable development for decades.
Understand the NetZero Brazil Platform
Brazil brings together unique and strategic conditions to lead the global ecological transition toward net-zero emissions. With a predominantly renewable electricity grid, the largest tropical forest on the planet, and a highly competitive agricultural sector, the country has mitigation options that are very different from other industrialized economies. Given the commitment to reach climate neutrality by 2050, it becomes essential to have robust, transparent scientific tools that support investment decisions and public policy design.
Inspired by the pioneering Net-Zero America study from Princeton University, NetZero Brazil establishes a permanently accessible Digital Public Infrastructure (DPI). Unlike one-off reports, this is an open, collaborative computational ecosystem. Its operational core, the NZB Machine, resolves the complex interactions between Brazil's energy, land-use, agriculture, waste, and macroeconomic systems, ensuring technical integrity and sectoral and spatial consistency at the interstate level.
The NZB Machine and its 8 Integrated Scientific Models
The NZB Machine coordinates the execution of 8 specialized scientific models, developed by national and international institutions. Rather than operating in isolation, the models exchange data automatically in the cloud: the output of one component serves as direct input for the next, eliminating manual methodological inconsistencies and reducing scenario processing time from months to just a few hours.
Energy Pathways (EP)
Accounting model for energy demand and industrial commodities.
State-level fuel and electricity demands. Feeds MACRO and MIP.
Transport Model (IEMA)
Projects road, non-road, and agricultural transport demand.
Detailed energy consumption by fleet/state. Feeds MACRO.
Waste Tool
Calculates emissions from wastewater and solid waste treatment.
State-level CH₄/N₂O emissions and energy generated from incineration.
MacroEnergy.jl (MACRO)
Economic and technological optimizer for energy supply.
Capacity additions, power dispatch, and energy transition costs. Feeds MIP.
MAgPIE-Brazil
Global partial-equilibrium model for land use and agriculture.
Land-use allocation patterns (0.5°) and agricultural sector emissions.
AFOLU Accounting (AAT)
Complementary representation of soil and vegetation management.
Removals in protected areas; emissions/removals by pasture condition.
SEALS
Spatial downscaling for fine-grained territorial mapping.
Land use and land cover maps at 300-meter resolution.
Input-Output (MIP)
Inter-regional macroeconomic and sectoral impact model.
Impacts on state GDP, employment, and value added by sector.
Scientific articles
Peer-reviewed publications produced by the NZB team or that use our data as a basis.
{{ a.title }}
{{ a.authors }}
{{ a.abstract }}
Materials for download
39 parâmetros para construir futuros
Cada parâmetro apresenta 4 opções (A a D) que representam diferentes escolhas de política, tecnologia e comportamento. Explore as combinações e entenda como cada decisão molda a trajetória de emissões do Brasil.